adeb26bd5873cdafdd545015ce06ca52

Branding Challenge Day 23. How to Share An Infographic

How to Share An Infographic

It may seem intimidating to write to people who are authorities or big public figures, but they’re just people like you. The worst thing they can do is say no, so don’t let fear keep you paralyzed. Learning how to share an infographic is an excellent skill to learn.

Make sure you follow up and thank those that have shared your infographic. Don’t bug anyone more than once if they fail to share your infographic. It’s possible to position yourself as a pest if you keep nagging someone to share. You don’t want to be branded as a troll.

Use the Power of Your Network

Ask your friends. Don’t forget to ask your friends to share your information. Most friends will happily retweet or share infographics that you create. If they’re appropriate for a wide audience, use the power of your friendships.

Submit it to directories. There are many places where you can share infographics such as Flickr, Visual.ly, and Infographics Showcase. These are places where you can share your infographic and it can be published for you.

People who are interested in infographics will browse these sites and when they find something they like, they’ll share it. This gives you another opportunity to show off your hard work and spread your message.

Tags are Crucial

Use intelligent tags so people can find your graphics. Share on places like Instagram and Pinterest. Don’t be lazy and forget to use tags. Some sites allow up to five tags.

Make your infographic searchable. Your infographic should be tagged with terms that make it easy to find. Tag it with keywords that are relevant to your audience, but for a broader reach, the terms “free” and “infographic” are crucial.

Adding these specific terms ensures that someone looking for a free infographic in your particular niche will come upon yours – and it might be just the one they’ve been looking for.

Don’t Leave Out Your Followers

Share it with your email list. Don’t forget to share your infographic with those who are already following you. Remember that people who “like” your FaceBook fan page may not see all of your posts.

But by delivering it directly to their inbox, they’ll be more likely to see it. If you send out a newsletter to your list, make sure you include your infographic in your newsletter.

And when you send it to them, don’t be afraid to ask them to share it. Many people just don’t think to share it unless you ask.

Use Video to share an Infographic

Create a video. You can take your image and create a video to go along with it. This is something you can upload to YouTube and share through your social media channels.

You can use animation software to make it yourself or outsource this little job to a pro on Fiverr for an inexpensive promotional tool. A video that mixes your infographic with a little bit of catchy music can appeal to a whole new audience.

Create a blog series. You can take different points from your infographic and break them down into an article series on your blog. This allows you to keep your infographic in the forefront of your readers’ minds.

It will also help you take the ideas that are simplified in your infographic and expand upon them. This really showcases your leadership in the niche and gives you multiple opportunities to have your graphic go viral.

Don’t Give It All Away At Once

Break it apart. Before you release the entire infographic, you might try breaking it down into smaller pieces and sharing them a little at a time. This is a kind of tease that will get your audience interested.

You can do this very simply by taking a screenshot and then cutting and pasting small sections to reveal each day. The anticipation can create a buzz so that when you actually share the entire infographic, people are already excited about sharing it as a whole.

Offer guest posts. You can also share your infographic by offering to write a guest post on a related blog. Sharing your image with about 400 words of content is the perfect way to expand your audience.

Create An Interactive Infographic

Create an interactive experience. When you create an infographic that’s interactive, it will be more likely to be shared. If people can click on your infographic or swipe their finger across it to achieve a different effect, it can get more attention.

Of course, this requires some advanced technical skills and you may have to hire someone to help you if you choose to try this technique. But it might be worth the investment if it leads to a bigger list and increased sales.

Getting Started with Infographics

Now that you know a little more about infographics, it’s time to add them to your marketing plan. If you’re not sure which topic to use for creating your first one, try one of these ideas:

* Look at the headlines and see if your business connects with the current news stories
* Ask your audience what they want to know – you may get a lot of great ideas for questions you can answer through an infographic
* Go through your email and blog comments and review the kinds of questions your readers are asking
* Brainstorm information that you can share with your readers – use your expertise
* Look for new research in your field and try to explain difficult concepts in a simple way that average people can understand
* Search on Pinterest for topics that relate to what you do and see what people are interested in
* Look at many examples of other people’s infographics to get ideas for how to present information and possible topics (without plagiarizing)
It may take you a few tries to get the infographic that is perfect for your audience and that really conveys the message that you want to share. But don’t be afraid to give infographics a try and see how they can help share your brand and make your message viral.

Infographics can be powerful branding tools when you use them properly and they garner a lot of interest. Make sure you create really good ones and share great information to get the most shares!

Branding Challenge Day 22.  What Not To Do with Your Infographic

Branding Challenge Day 22. What Not To Do with Your Infographic

What Not To Do with Your Infographic.

After you’ve created an infographic, it’s important to go through a checklist of things that you should avoid and make sure that you haven’t done them. You must use a critical eye for best results.

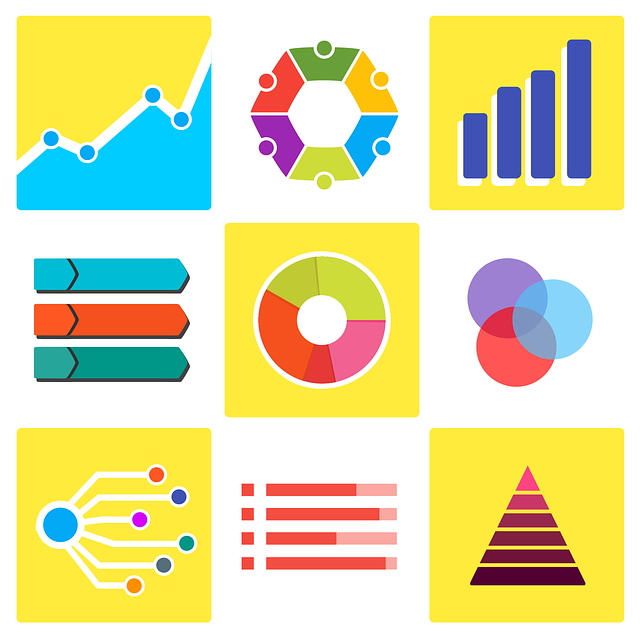
Don’t only use data charts. Infographics can have charts in them, but if your infographic is simply a pie chart or bar graph, then you’ve missed the boat. The infographic should tell a compelling story.

Infographics are about more than data

When was the last time a pie chart elicited an emotional reaction from you? Always make sure that if you use a chart, it’s connected to a story and isn’t the only thing on your visual.

It’s okay to have charts and graphs, but you need to add a few accessories. Speaking of charts, make sure you match the right type of chart to the data that you’re sharing. For example:

* Pie charts are great for representing percentages

* Bar graphs are perfect for making comparisons between groups

* Line graphs are most appropriate when you’re showing change over time

And if you find that the data you have doesn’t fit into any of these categories, you’ll want to look for a different way to visualize it.
What Not To Do with Your Infographic

Don’t use too much text.

On the other side, remember the rule of keeping your text minimal. If you can show something visually, do it with a picture, not words. For example, instead of saying “5 people” show images that represent 5 people – you can easily find graphics to go with many different ideas.

Don’t use too much color.

An infographic can look chaotic and messy if you use too much color. It’s a good rule of thumb to stick with three different colors. That doesn’t mean you can’t have a few other colors as accents, but stick with the three color rule to keep your palette clean.

You should also stay away from colors that are too bright – you don’t need to shock your readers or cause eye strain online with neon shades. Instead, you want colors that are pleasing to the eye so that your reader can take his time looking at the infographic.

Don’t make it too big.

Infographics should be simple and streamlined. Avoid the urge to make a huge infographic that has too much information. If it’s overwhelming, your reader isn’t going to take the time to look at it and he or she certainly won’t share it.

Don’t neglect to add a hook. Infographics work best when you have an important message to send. Don’t create an infographic just to make a pretty picture. If there’s no hook that captures the attention of your prospect, then your infographic won’t be successful. A hook will be your website or logo.

Don’t blatantly sell a product.

An infographic works best when it’s an education tool that leads back to your site. Don’t use it to sell a product directly. Instead, use it to inform people and gain interest. People who are interested can eventually convert into sales.

Tips for Promoting Your Infographic

Your infographic can be beautiful, but if no one sees it, you won’t get much good out of it. It’s important to spend the time and effort to make sure your infographic gets noticed and increases the chances that it goes viral.

Select an infographic home. You’ll want to give your infographic a permanent home where it can be parked. Ideally, this will be where you want to drive the traffic to. So in most cases, it’s your blog or main website.

Hosting the image yourself makes it easy for you to create several versions that others can easily share. For example, you’ll want to have the original infographic that has a higher pixel count, a smaller file that’s easy for any website to handle and load quickly, and a thumbnail for sharing on Facebook.

Make it easy for Others to Share

By providing the embed codes for all of these on your “home” page, you’ll make it easier for others to share it in the way that works best for them. You’ll also have a wide variety of options for sharing it through your own channels.

Share on social media sites. Infographics that are well-made and tell a great story can actually promote themselves if you share them on social media. On Facebook, Pinterest, and Twitter, it’s so simple for readers to like and share infographics that you can get natural promotion.

Take advantage of programs that allow you to create many posts and tweets over time. For example, with Hootesuite, you can pre-write all of your tweets and then have them automatically sent out over a period of time.

Drip feeding some of the facts from your infographic and then linking back to the entire image can be very effective, too. This is teasing your audience, so pick something from it that’s very tempting.

Put time into promotion.

You may spend hours getting your infographic just right, so don’t sell yourself short by sharing it one time and then moving on. It can take time for something to get picked up and become viral.

That means sharing your infographic often over a period of time with as many outlets as possible. If weeks go by and you’re not getting any results, you probably need to move on, but don’t give up after a single day.

Produce a press release. A press release can help you get more notice. Write a press release that shares your infographic and the reasons why you chose to share this information to your audience.

You can submit your press release for free to many online sources and get more exposure for your infographic and more traffic to your site. Make sure you upload the file with your press release so that anyone who picks it up can publish it with your URL on it as well.

Don’t miss Cross Promotion Opportunities

Reach out to possible partners. Look for businesses and people who have similar interests and audiences for possible cross-promotion. Make a list of anyone and everyone you can think of that might be appropriate.

Share your infographic with them and ask for their feedback. Look for blogs that are similar to yours and email them directly to share your infographic. Let them know how they can embed your infographic by sharing the embed code.

Message people directly through Twitter who you think might be interested and willing to share your infographic with their followers. You can do the same for people you know through Facebook connections.

Branding Challenge Day 21. What makes a great infographic?

Branding Challenge Day 21. What makes a great infographic?

Delicious Save this on Delicious

What Makes a Great Infographic?

Anyone can throw some visuals together and make an infographic. But not all infographics are really good. So what makes a great infographic? It’s important that you have the right elements put together.

It has to have s purpose. Before you start to create your infographic, you need to think about your purpose. What do you hope to share with your readers when they look at your visual representation?

You also need to think about what it is you want your reader to do as a result of looking at your infographic. If the purpose is to get them to visit a site or take another action, it will help you to know that ahead of time so you can build momentum using your image and text combination.

Before you ever get started with the actual creation of your infographic on the computer, take some time to sketch out what you want it to say and create a list of bullet points.

It needs to tell a story. A great infographic does more than share numbers and data. It provides information that’s interesting and actually tells a story that connects to your audience.

A great infographic will state a problem or bring up an issue that’s important to your readers. It will also provide a solution that makes it useful and interesting for anyone who reads it.

Historical Infographics

You can also tell a story by using an infographic as a timeline to explain a current event, biography of a person, or how a problem began.

It should be well-timed. Infographics based on current events and trends are going to get more notice than those based on last year’s trends. Take advantage of news stories and consumer trends when creating your infographic.

Get ideas by looking at other people’s graphics. A great way to research this is to Google your topic. For instance, if you want to design an infographic about list building the Google “list building + infographic”

When you see a major story in the headlines that relates to what you do, it’s the perfect time to produce an infographic and share it. You might even want to have a template of your own on hand for breaking news stories in your niche.

What makes a great infographic?

All infographics should be empowering. People will respond with more emotion and connection to infographics that are empowering. That means providing information that will allow your readers to act in a way that’s beneficial for them. Also, the more emotive the infographic is the more likely it will be shared. Once it is shared more people will become aware of your name and brand.

All infographics should be focused.

Your infographic should be narrowly focused. You don’t want to try to tell your readers everything you know in a chart. This should be simple and streamlined so that it’s not overwhelming or confusing.

It should have a great design. It may sound obvious, but you want your infographic to be pleasing to the eye. That means being careful to choose colors that go well together and using images that look cohesive.

You want to use as little text as possible – meaning no long paragraphs, but bite-sized chunks of text instead. Remember this is about giving a visual image. And whatever text you do use should be very clear and readable – so it’s always a good idea to try different fonts until you find one that works best for you.

It’s also important to keep the file as small as possible so that it can still be accepted by social media sites. At the same time, don’t sacrifice clarity to maintain the small file size.

If you feel like your infographic has too much on it, ask yourself if it’s possible to split the topic into two narrower topics. Sometimes that helps. So for instance, instead of one infographic for weight loss that included diet and exercise, you could split those two off into their own infographics.

You also need to keep your infographic as vertical as possible. Today we live in a world where people are using small monitors on tablets and smartphones. When you make your infographic vertical, it’s easier for a reader to scroll through on a mobile platform.

Make sure your infographic is true

Your infographic should have reliable data that’s true and can be backed up. If you put out an infographic that turns out to have inaccurate, false information, you’re going to lose trust with your audience.Also, you can make yourself open to legal action in some circumstances.

Remember that you’re always working to build trust and relationships with your readers. Don’t sacrifice that to get attention. It will turn out to be the wrong kind of attention once the facts become clear. If you use outside sources for information, make sure that you cite those.

Make sure it includes your brand. Every infographic that you produce and share should have your logo (if you have one) and a link to your site.

This has a dual purpose it reinforces your brand on your site. When the infographic is shared it acts to increase your brand awareness.

It also increases the traffic to your site and will enhance your search engine optimization. It’s no good to waste your time creating a beautiful infographic that doesn’t actually help people get to know who you are.

Be sure to edit it properly. Once you’ve created an infographic, you need to show it to someone else before you begin promoting it. Having a second set of eyes to catch mistakes in spelling or to help you see where your graphic needs work is invaluable.

When you’ve been looking at something for a long time, you tend to overlook mistakes. Also, something may make complete sense to you but be confusing to someone who doesn’t have all of your knowledge and perspectives.

Ask a few people to give you their thoughts and reactions before publishing your infographic and promoting it.What makes a great infographic? is to be continued tomorrow.

Branding Challenge Day 20  Using Infographics to Brand Your Business

Branding Challenge Day 20 Using Infographics to Brand Your Business

Almost every day I see an infographic on Facebook, Pinterest, or other social media. They’re really not anything new, but they might seem new because they pop up so much these days.Using Infographics to Brand Your Business is a smart move.

Think about what you see as you scroll through your newsfeed. You might see a diagram that shows you what the day’s weather is going to look like. You might see a chart that shows how to follow a new fitness craze.

It’s not uncommon to find a visual representation of how to cook a specific recipe. Or maybe all the ways you can use herbs to get healthy. The term “Infographic”  encompasses all of these concepts and is a great way to brand your very own business.

What Is an Infographic?

Infographics are visual representations used to share information. They do this in a way that’s easy to read and understand. One of the earliest and most common uses of infographics is in your local weather forecast.

By simply scanning the small picture you can see if it’s going to be sunny or rainy.  What the temperature is, and any weather trends for the week. It’s simply a quick and easy way to get the data you need.

And if you notice, it usually includes the television station’s logo on it, too. Look in the lower right corner of this one, and you’ll see the channel number and NBC logo for branding. The completed infographic is then very shareable from their social media sites.

Infographics can be very simple, or they can share more complex ideas. But the beauty of this type of visual image is that even a complicated idea can seem simple to the average consumer when represented this way.

You can use an infographic to tell the story of your business, share a tool that your customers can use, help people understand a process, promote your brand and encourage people to come to your site.

An infographic can really be used to express any kind of information that you want to share with your audience. It can have pictures, a flow chart, numbers, and words artistically arranged in a simple way to catche the eye.

Some of the best topics to use for infographics include:

* Facts that might surprise your audience
* Instructions for your customers (for example how to join a contest or use your product)
* The success rate of your product
* Taking something really complicated and making it easy to understand
* Making comparisons
* Illustrating trends
* Showing a timeline
And these are just a few examples. There are endless ways that you can apply infographics to your business. Once you start to use them, you’ll find more and more ways to do it.

Why Use Infographics?

Infographics are powerful branding tools and you should look for ways to incorporate them into your own branding plan. There are many reasons why these simple visuals make a big impact.

They’re eye catching. Statistically speaking, visual posts on social media sites get much more interaction than those that only use words. When you’re scanning your Facebook newsfeed, you’re much more likely to stop and look at an infographic than a text-only status update.

They’re easy to embed. You can add infographics to all kinds of platforms including a WordPress blog, Facebook, Pinterest, Twitter and more. It just takes a single click to add an infographic to your blog post, status update, or Twitter feed.

They’re shareable. Once you’ve uploaded an infographic, it’s easy for others to share it by pinning it, sharing it in their Facebook newsfeed, or retweeting it. That means your post is more likely to go viral.

It gives you a spike in traffic. When you have an infographic, you encourage people to click and share, which increases the traffic to your blog or other websites.

You’ll naturally encourage others to link to your site, which will also improve your search engine optimization. We all know that Google appears to be looking at the social gravity a site has – the organic following it commands online.

It creates authority. By sharing information through an infographic, you represent yourself as an expert authority on a particular subject. People will begin looking to you for advice or to ask questions.

They give you branding power. Infographics can easily be used for branding when you add your logo and URL. Every time your infographic is shared, more and more people will learn about you and where they can go to learn further details or purchase a solution.

They’re fun and engaging. Infographics are a fun way to share information and they will help you develop a greater connection with your audience and potential clients.

Ideally, you want to develop relationships with your customers and infographics are a great tool to help you do that. They’re a way for you to speak to your audience through their senses.

DIY Infographic

If you’re a little nervous about making graphics, there are some great tools to help you make them with ease. Piktochart, for example, is a great site that offers free tools for making infographics.

You can also upgrade to a pro membership with a monthly or yearly fee to get access to even more templates. First, you’ll need to go to piktochart.com and set up an account so that you can begin.

What Makes a great infographicOnce you have an account, it’s easy to create your own infographics in minutes. You’ll first select the infographic format that you want to use and then scroll down to see all of the templates you can use.

Although many of them are free, there is a greater choice for premium mebers. You can also create one from scratch. Once you choose a template, you’ll be prompted to name your piktochart.

Once you do that, the next step is  an editor screen where you can change the text, add images, and make changes to the colors and background. It’s a very user-friendly interface that makes it easy to get just the right infographic for your business.

Don’t forget always to add your logo and URL so that as you share your infographic, you’re also sharing your brand to a wide audience. From piktochart, your website will be hyperlinked so that people can easily click on it and go right to you.

Once you have your infographic just the way you want it, you can save it, download it, or share it on social media right from the editor screen. It’s really easy – even for someone who doesn’t love dealing with graphics.

There may be other tools on the market, but this is the one that I use for creating eye-catching infographics of my own if I’m not outsourcing, which is my preferable method.

Outsourcing an Infographic

If you really just don’t want to deal with your own graphics, you can also hire someone else to do it. Fiverr is a great resource for inexpensive infographics – you just give the information and someone else will do the graphics work.

But don’t expect a good one to really cost $5. A decent infographic will have add on expenses. Sometimes, you can find a good Fiverr gig where you choose a template or just tell the graphic designer what you want and you provide the wording for them to fill into the picture.

When you only need an occasional graphic, outsourcing might make sense. But if you’re going to make a lot of them, it might make more sense to learn how to do it yourself and use a tool like Piktochart.

Using Infographics to Brand Your Business Part 2 will be published tomorrow.


Branding Challenge Day 19. Create the perfect press release

Branding Challenge Day 19. Create the perfect press release

Create the perfect press release to Shout About Something Newsworthy

Press releases are a tool I don’t hear a lot of buzzes  about – mainly because I think the focus in marketing is on writing articles, blogging, JVing, etc. But it’s something you shouldn’t overlook. Create the perfect press release when you have got something to really shout about – like a new product launch.

In fact, all of my guru clients always had me write press releases (I charged $100 per page) for each project they released. They just don’t teach it themselves a lot.

I just recently saw E. Brian Rose (one of the JVZoo founders) link to his press release, which was picked up by Yahoo Finance   – so the top dogs are in fact using Press Releases, but the littler marketer hasn’t been using them to build a buzz.

So one tool that regular non-Internet marketers use when they want branding and coverage is a press release. There’s a WHOLE different way of writing a press release that I’m going to teach you because I see a lot of disasters.

The great thing about press release sites is that they’re similar to article directories in that other people can pick them up and use them on their own sites. News directories and websites will grab it – sometimes even an offline publication searching for experts in a particular niche.

This series is all about branding you as an expert or leader, so that’s what this tool is perfect for! You might even pick up some media interviews in magazines, newspapers or even Television.

The Goal of Your Press Release

Create the perfect press release
Forget article marketing. Clear your head of everything you’ve learned. There’s a reason press releases are so costly compared to other services – they’re well-crafted newsworthy stories.

The goal of your press release is to help position you as a leader as you share some sort of opinion and insight on a trendy topic. We can all find something trending in our niche somehow – use Google news and DIG.

I was so scared of submitting press releases when I was starting out as a blogger because the traditional publications said that if you sent a poor press release, it would go straight into the trash and they would never read anything you ever sent again.

That’s a lot of pressure! But that pressure is good because it forces you to craft this carefully – not whip something up in a flash and put it out there. That’s the wrong way to do this, so feel free to take a week or more to get this tool mastered. Don’t rush it.

You’re going to be coming up with a news slant, writing an informative piece with YOU as the quoted resource, submitting it to the proper PR outlets, and then doing a few other tasks to help spread the news of its existence.

Here’s the good news and bad news – and it’s one in the same. You only have ONE page to use for your press release.

That’s good because it alleviates the pressure you may feel of having to create something long and intimidating. It’s bad because some people like to babble on and on, and cutting their words down to a single page is excruciating for them.

How to Write a Press Release

First, I want you to think about your own expertise or leadership role in your niche. Don’t go all Eeyore on me and start saying nobody cares about you or your opinion – get an ego and think of how you can brag about yourself!

The first thing you want to do is link about what makes you qualified to lead this niche. It could be based on time dealing with the niche, personal experience in it, the fact that you’ve helped someone else in the niche, the knowledge you’ve accumulated, etc.

You can quote yourself in the Press Release as the expert.

Like this:

…said Catherine Ford, Psych-K practitioner.

Yours might be something like this:

…said Leo Randall, owner of diabetescurediet.com.

Or:

…said Tom Knightly, relationship blogger at MeetMrRight.com.

Just have a blurb figured out and a few reasons why you feel qualified to help others in your niche. It can be based on personal experience, an education you’ve gained, or anything that makes other people feel like listening to you.

The Formula of a press release

When you write your press release, put everything important in the beginning and the least important items at the bottom. With Internet Marketing, you have often been taught to do the opposite, such as hook the reader at the beginning with something that will make them wonder.

You can’t do this with a press release. You need to be straightforward and factual in the outset. In that JVZoo press release, for example, it starts off full of facts – nothing vague and curious. Here it is:

“JVZoo.com, the premiere online marketplace for digital information products, today announced its members had generated over $75,000,000 in revenue since the site’s launch in 2012, proving it is a force for independent job creation in the wake of global economic hardship.”

Nothing intriguing about that. You know what the story is about immediately.

So what are your facts?

It can be something about the niche. So for instance, let’s say I wanted to write a book about a make money online course.

I might cite the Census statistics and say something like this: “With Census statistics showing more than one-third of Americans on welfare, new online entrepreneur course helps jobless have some hope.”

Or, if your course has already sold a certain amount or helped a set number of people, you could cite that instead. The first paragraph should always be the main slant of your story. Whatever it is you want them to know – spelled out quick and easy.

Make sure you don’t write anything spammy.

You don’t see that JVZoo introduction says, “Learn how to CRUSH the competition and give your boss a pink slip by joining our done for you marketplace…” (You get the point – no spam or hype – just the facts, please).

The same goes for your headline. Notice that Yahoo Finance picked up the JVZoo press release – because it was impressive and clear. So how do you turn a perceived boring topic into a newsworthy opening and headline slant?

Well, let’s say you want a press release for your diet blog. But it’s a review site, and you’re not even creating anything yourself. Since it’s a review site, think of something you, as a reviewer, have discovered in your blog journey.

So for instance, it might be like this:

“Diet Blogger Suffers Backlash for Refusing to Endorse Unsafe Trends” (if you’ve gotten a comment from someone disagreeing with you, for example). Or…

“Weight Loss Advocate Warns Too Many Women Flirting with Diet Dangers” (if you want to promote a safe weight loss mindset as opposed to a fad one).

Numbers always do well. So let’s say you run a diet blog and you try out different diets and report on them. You might use a headline and slant like this: “Diet Blogger Sheds 28 Pounds Trying on New Diets for Size!”

Usually, with a press release form, you’ll have your headline and introduction, but in between that is a space for a subhead. That’s where you expand on the headline a bit, but continue being newsworthy and factual and not riddled with hype.

As you craft the body of your press release, keep getting the most relevant facts out first. You want the reader to have gotten the gist of it just by reading your headline if nothing else.

You never know which part of the press release will make them stop reading. So in your body, you’ll include more facts – and also a quote or two. You can quote yourself in the press release. You don’t have to interview another expert. You can also get quotes from clients or customers if you want.

And at the end of your release, you’ll have room for your “for more information, go here” portion of the story – which is most important to you because it means increased traffic and possibly sales.

So here’s what your formula looks like:

* Headline
* Sub-headline
* Introduction paragraph
* Quote paragraph
* Details paragraph
* Quote paragraph
* Details paragraph
* For more Information paragraph

That’s about all the room you’ll have if you keep it at the desired one-page length. In your introduction paragraph, always start it with bold lettering that gives the following information: (City, State) Date – (then start the paragraph).

At the very end of your press release, end it with ### – which is the standard signal for “the end” in the Journalism world of press releases.

Where to Submit Your Press Release

You should use press releases as often as possible. Don’t just use them for product launches or blog launches. Use them for blog posts, too! You might want to find a good ghostwriter who understands how to create newsworthy press releases and have them develop one for some of your most riveting content.

On most press release sites, like the ones below, you’ll typically find both a free and paid option. There’s no need to go insane with your memberships. Start out free if you’re on a budget and if you start seeing good branding results, then see which service is providing it and maybe increase your membership on the top one to see if it makes a big difference.

Here are some of the most popular ones:

http://www.prweb.com/
http://www.prnewswire.com
http://www.pr.com
http://www.directionsmag.com/pressreleases/add/
http://www.prlog.org/submit-free-press-release.html
http://bignews.biz/?go=publish
http://www.freeprnow.com/submitPR.aspx
http://prwindow.com/login.php
http://www.exactrelease.org/submit.php
http://www.forpressrelease.com/login.php
http://www.prfree.org
http://www.webnewswire.com/node/2058593
http://beforeitsnews.com/
http://prsync.com/submit-press-release/
http://freebusinesswire.com/login.php
http://www.prhwy.com/submit-press-release.html
http://www.orilliapacket.com/ugc/submission
http://www.freepressreleases.com/
http://pressbox.co.uk/cgi-bin/links/add.cgi
http://articlecirculation.com/submit.asp
http://www.pressabout.com/submit-press-release/
http://www.press-release-articles.com/register/

Create the perfect press release and start with the top three. Then try to find a news site specific to your niche that accepts press releases – for example, a health site or a financial site. You might get better results going with a narrower, niche specific PR site than a broad one.

1

Branding Challenge Day 18. Marketing Strategies for Product Owners 2

Branding Challenge Day 18. Marketing Strategies for Product Owners 2

BRANDING CHALLENGE DAY 17 IS HERE

Marketing Strategies For Promotion

Now it’s time to take a look at the marketing channels and tactics you think you’ll use to promote your products and services. Again, because you’ll be referring to your marketing strategy often, it’s a good idea to write down your reasons behind each marketing channel decision and even some thoughts on how you’ll use it. Common marketing tactics include, but aren’t limited to

  • Website
  • Branding
  • Content marketing
  • Blog
  • Social media
  • Email marketing
  • Direct marketing – postcards, brochures, flyers
  • Advertising – online advertising and print advertising
  • Live events – webinars, seminars, workshops
  • Affiliates
  • Referral program

6 Creating and Defining Your Brand

What do you want people to feel when they think of your business? Your brand is the core message that people receive. It’s part of every single marketing piece you will ever create, or it should be. A robust and consistent brand helps your prospects know what to expect. So what do you want them to expect from you?
Your brand is more than your logo, which symbolizes your brand. Your brand is the voice you use in your content. It’s the message that you send to your audience and the feelings that you evoke in them. Your brand encompasses all areas of your business including.

It can be tempting to leave certain areas of your business outside fo the confines of your brand. This is usually a mistake your brand is your business and cannot be treated separately. :-Your brand includes but is not linited to:-

    • Reputation
    • Customer Service
    • Your Promise
    • Price
    • Feeling
    • Tag line
    • Attitude
    • Logo
    • Product Line

Think about vigorous and memorable brands like McDonald’s, Nike, or Amazon. What three or four words do you think of when you think about those businesses?
Now, what three or four words do you want people to think of when they encounter your business? Work on creating a tagline that evokes the feelings you want people to have. Work on your logo, and decide what voice and message you want your brand to communicate.

7. Budget

This component is pretty straightforward. How much money do you have to spend on marketing right now? What percentage of your profits will you allocate toward marketing? Also look at the marketing channels you can afford right now. For example, can you manage a small PPC campaign, email marketing, and blogging?
Think about what tasks you can manage yourself and what marketing channels and efforts you’ll need to outsource. Price out the cost for the outsourced tasks. For example, a professionally written sales page can cost a thousand dollars or more. It’s important to have this information before you begin creating your marketing budget.
You may also begin planning for the future and document how you’ll expand your marketing budget as your sales and profits increase. What are your priorities? What marketing channel will you add first? For example, will you begin hosting live events or send direct mail pieces? How will your budget be allocated as your business grows?

8. Your Marketing Goals

This may be the most important element of your marketing strategy. Your marketing goals need to be aligned with your business goals. Initially, your marketing goal may be idealistic and unmeasurable. For example, top-level goal may be to “Create the most visible and active brand in your industry.”
That top level goal can then be fine-tuned by using the SMART approach.
026f6196cb2d3e9b54e7553fd72d4948_1476096619_cropped
Specific – What exactly do you want to achieve?
Measurable – How will you know you’re successful? What will you measure?
Attainable – make sure it’s actually possible to achieve your goal. Unrealistic goals are frustrating at the very least and defeating.
Relevant – The goal supports your business goals and your target audience.
Time bound – When will you have achieved your goal? What’s the deadline?
Now measuring brand activity can be difficult. You might measure website traffic, social media interactions, and email subscribers along with brand mentions.

A SMART version of your top level goal may be

To increase brand mentions on social media by 10% in the first quarter. Your marketing goals are the foundation of your marketing plan. Without clear goals, you won’t have a direction for your marketing tactics. You’ll be operating in a void without an objective or a reason for marketing.

Your Marketing Plan

There’s often some confusion between a marketing strategy and a marketing plan. Your strategy is part of your business plan. It’s an explanation of what you need to achieve. Your marketing plan is a roadmap of how you’re going to achieve your marketing goals.
Your marketing plan embraces all of your marketing channels. You’ll create measurable goals with clear deadlines. For example, the goal to increase brand mentions on social media by 10% in the first quarter will be detailed in the marketing plan. It answers the question, “How will you increase brand mentions on social media?”

This is one of the reasons a marking strategy is so important. It’s easy for marketing tactics to get out of control. It’s easy to lose direction. Your strategy reminds you what you want to accomplish and why. It’s also something that needs to be reviewed on a regular basis. Consider revisiting your marketing strategy at least every six months. It may make more sense to review it quarterly. Perhaps when you are starting out it should be re-assessed monthly.
h1<>Measure C

Things change in business because you in certain circumstances your business is driven by circumstances beyond your control. Examples here are profound political changes, such as the British decision to leave the Common market.This could derail a fledging business because of currency fluctuations. Which is why you have to reassess and reassess often especially in a fledgling business.
Assess your marketing goals. Is your marketing plan achieving your goals? Has your target audience, budget, or competition changed? Your marketing strategy isn’t set in stone. It’s a document that can and will change as your business changes. Use your marketing strategy as the foundation for a strong marketing plan and a growing business. It just may be the most useful document you ever create.